Monthly Service Level Processing
4/26/2022 - Customer Service logic changed: https://jira.sacsewer.com/projects/ITSD/reports/all-rating
4/22/2022 - From Jeff
GOOD NEWS!!!! Change to quarterly reporting...
They are now ANNUAL reports! They are now due annually on Aug 1st. The next report (due Aug 1, 2022), should cover from the last quarterly report through July 31, 2022. Next year's report will cover July 31, 2022 through July 31, 2023. I just realized in writing this that they are due (Aug 1) the day after the reporting period end (Jul 31) leaving no time window to prepare them. We'll figure that out. For now, focus on the good news...no more quarterly reporting!
4/22/2021 - todo: Review the following that jeff just wrote: How to gather monthly metrics and record them in the ISD Quarterly Report
4/22/2021 - Checked in. Hopefully my contributions are helpful. 


12/15/2020 - todo: From Marty - Regarding the Additional Notes page, my thought is to retitle it Leadership Notes or something along those lines and lock it for viewing to Jeff, Gene, Dan, AFShin, and myself. We may decide to open it up in the future. Let me know if you have any questions.
11/5/2020 - todo: From Marty - For the survey fails, can we exempt the ones with Neutral responses (unless they also have Disagree in the same survey)? I am concerned with the Disagree or Strongly Disagree responses.
10/1/2020 – Can we replace the service levels spreadsheet with a confluence page? It is IT only? (Jeff Gave Tentative Approval)
- Here is the confluence page: Service Levels - 2020-09
10/6/2020 – review script – the assumption is that the jira data tables will start growing, so we may need date checking logic.
10/7/2020 - moving process to Confluence
9/28/2020 – check these confluence pages
- https://confluence.sacsewer.com/pages/viewpage.action?pageId=45188983 – IT Metrics & KPIAs
- https://confluence.sacsewer.com/display/IT/Critical+Systems - Critical Systems
9/24/2020 – message from jeff
Hi Mark - I have some more good news for you. In addition to getting you out of the dreaded budget meeting, I have an update on metrics and KPIAs. Long-term, I want to get you completely out of these to, but in the meantime, we are drastically reducing what we are going to report on! Please see this page: https://confluence.sacsewer.com/pages/viewpage.action?pageId=45188983Note the "Data Reliability" column. All those red/low will no longer be reported on, and you can remove those from your monthly/quarterly process.
If you have any questions, please let me know. I don't know how much you care about why this is happening (but it came from Matt!). I am happy to share, though, if interested!
Changes
- 11/3/2020 - cleanup of document. Updated Monthly Tickets Resolved, and Monthly TIckets Created to compute last period.
- Oct 2020 - We are only tracking KPI's that can be accurately computed. so the following were dropped: ***
SLA and IT Metrix Process
- Revise the process to cache the data rather than delete the data. We might need this for quarterly processing
- Can we revise the queries to automatically compute start/end dates of last month
- I wonder if there is a way to automate pulling data out of Jira, and moving it to SQL. (Perhaps node.js and puppeteer)
- Review Elastic - what can we get from this?
- From Marty - For the survey fails, can we exempt the ones with Neutral responses (unless they also have Disagree in the same survey)? I am concerned with the Disagree or Strongly Disagree responses
Confluence note
https://confluence.sacsewer.com/pages/viewpage.action?pageId=2721163
1st of month
Go into Jira, Projects - Choose ITOPS. Expand the side menu. Pick Reports
Pick SLA Success Rate
Select Past Year by Month
Bottom of the chart will show the last few months (ex May 2021 - 99.4, 100.0%, June 2021 - 99.6, 100.0%, July 2021 - 100%, 98%)
Hmm, those give us percentages, but not counts.
Todo add a link to the SLA Page: https://jira.sacsewer.com/projects/ITSD/reports/custom/5/timescale/8 this gets you to the report
Go into Jira, Issues – Search for Issues. Pick the "Monthly Tickets Created" query
- confirm the date fields (if needed)
- Use the Export > Excel (All Fields) function to export to excel
Open the spreadsheet that was exported
Remove the first 3 rows, the graphic in cell A1 which you cannot see, and the last row
- 7/8/2021 - 1982 rows
- 6/16/2021 - 1685 rows
- 5/18/2021 - 1915 rows
- 4/13/2021 - 2027 rows
- 4/13/2021 (for Feb data) - 1533 rows
- 2/4/2021 - 1784 rows
- 1/7/2021 - 1806 rows
- 12/8/2020 - 15643 rows
- 11/3/2020 - 2055 rows
- 10/02/2020 – 2080 rows
- 9/2/2020 – 2316 rows
- 8/3/2020 – 2431 rows
- 7/2/2020 – 2480 rows
Save as “20191201 – Created tickets” type=.XLSx in Z:\Programming\District Quarterly Reports\Downloads
Using sql server, switch to database sdd-sql1.district
Import into SQL Server to sdd-sql1.district.performance.JiraItsdCreated
- 7/8/2021 - 1981 rows transferred
- 6/16/2021 - 1684 rows transferred
- 5/18/2021 - 1914 rows transferred.
- 4/13/2021 - 2026 rows transferred
- 4/13/2021 (for Feb Data) - 1532 rows transferred
- 2/4/20201 - 1783 rows transferred
- 1/7/2021 - 1805 rows transferred
- 12/8/2020 - 1562 rows transferred
- 11/3/2020 - Restoring 9/2 - 2315 rows, 10/1 - 2079, 11/3 - 2054
- 10/1/2020 – 2079 rows transferred
- 9/2/2020 – 2315 rows transferred
- 8/3/2020 – 2430 rows transferred
- 7/2/2020 – 2479 rows transferred
Delete from performance.jiraITSDCreated where project is null
- 7/8/2021 - 1584 rows affected
- 6/16/2021 - 1346 rows affected
- 5/18/2021 - 1530 rows affected
- 4/13/2021 - 1620 rows affected
- 4/13/2021 (for Feb Data) - 1224 rows affected
- 2/4/2021 - 1426 rows affected
- 1/7/2021 - 1444 rows affected
- 12/8/2020 - 1248 rows affected
- 11/3/2020 - 5146 rows affected
- 10/1/2020 – 1662 rows affected
- 9/2/2020 – 1844 rows affected
- 8/3/2020 – 1938 rows affected
- 7/2/2020 – 1981 rows affected
Go into Jira, Search. Select the Monthly Tickets Resolved
Use the Export > Excel (All Fields) function to export to excel
Remove the first 3 rows, the graphic in cell A1 which you cannot see, and the last row
- 7/8/2021 - 1947 rows
- 6/16/2021 - 1610 rows
- 5/18/2021 - 2100 rows
- 4/13/2021 - 2092 rows
- 4/13/2021 (for Feb Data) - 1448 rows
- 2/4/2021 - 1840 rows
- 1/7/2021 - 1861 rows
- 12/8/2020 - 1498 rows
- 11/3/2020 - 2131 rows
- 10/1/2020 – 2515 rows
- 9/2/2020 – 2194 rows
- 8/3/2020 – 2295 rows
- 7/2/2020 – 2527 rows
Save as “2019-12 – Closed tickets” type=.XLSx in Z:\Programming\District Quarterly Reports\Downloads
Import spreadsheet into SQL Server to sasdddb1.District.performance.JiraItsdClosed
- 7/8/2021 - 1946 rows transferred
- 6/16/2021 - 1609 rows transferred
- 5/18/2021 - 2099 rows transferred
- 4/13/2021 - 2091 rows transferred
- 4/13/2021 (for Feb Data) - 1447 rows - I had to block the Resolution Notes column, There was an import error.
- 2/4/2021 - 1838 rows transferred
- 1/7/2021 - 1860 rows transferred
- 12/8/2020 - 1497 rows transferred
- 11/3/2020 - Restoring 9/2 - 2193, 10/1 - 2514, 11/3 - 2130
- 10/1/2020 – 2514 rows transferred
- 9/2/2020 – 2193 rows transferred
- 8/3/2020 - 2294
- 7/2/2020 – 2530 rows transferred
4/6/2020 – the export contained a column named ‘resolution’ which had a lot of nulls?
Delete from performance.JiraITSDClosed where project is null
- 7/8/2021 - 1556 rows affected
- 6/16/2021 - 1286 rows affected
- 5/18/2021 - 1678 rows affected
- 4/13/2021 - 1672 rows affected
- 4/13/2021 (for Feb Data) - 1146 rows affected
- 2.4.2021 - 1470 rows affected
- 1/7/2021 - 1488 rows affected
- 12/8/2020 - 1195 rows affected
- 11/3/2020 - 5456 rows affected
- 10/1/2020 – 2010 rows affected
- 9/2/2020 – 1746 rows affected
- 8/3/2020 – 1830 rows affected
- 7/2/2020 – 2022 rows affected
Export the survey database out of Sharepoint into sasdddb1.district.performance.survey
- Use IE11
- navigate to http://inside.sda.saccounty.net/helpdesk/Lists/survey/AllItems.aspx to the survey list
- Click all items
- Use list > export to excel - open and create a file. Something like Z:\Programming\District Quarterly Reports\20180604 – Survey for May.
delete from [performance].[Survey]
- 7/8/2021 - 1752 rows affected
- 6/16/2021 - 1724 rows affected
- 5/18/2021 - 1679 rows affected
- 4/13/2021 - 1607 rows affected
- 2/4/2021 - 1579 rows affected
- 1/7/2021 - 1546 rows affected
- 12/8/2020 - 1517 rows
- 11/3/2020 - 2972 rows ???
- 10/1/2020 – 1486 rows
- 9/2/2020 – 1393 rows
- 8/3/2020 – 1352 rows
- 7/3/2020 – 1312 rows
Use the SSMS Import Data function to import data into sasdddb1.district.performance.survey
- 7/8/2021 - 1771 rows transferred
- 6/16/2021 - 1752 rows transferred
- 5/18/2021 - 1724 rows transferred
- 4/13/2021 - 1679 rows transferred
- 2/4/2021 - 1607 rows transferred
- 1/7/2021 - 1579 rows transferred
- 12/8/2020 - 1546 rows transferred
- 11/3/2020 - 1517 rows
- 10/1/2020 – 1486 rows
- 6/2/2020 – I had an error in pre-execute – to make the import work, I had to ignore the comments column in the mappings table
- 7/2/2020 – this wasn’t necessary
- 9/22020 – error, I ended up ignoring both the comments column and the improvements column
- 9/2/2020 – 1451 rows transferred
- 8/3/2020 – 1393 rows transferred
- 7/3/2020 – 1352 rows transferred
execute the following statement to compute monthly tickets received and closed.
--
Select count(*) created
from performance.JiraItsdCreated
where [Time to resolution] is not null
and [created] between DATEADD(MONTH, DATEDIFF(MONTH, 0, GETDATE())-1, 0) --First day of previous month
and DATEADD(MONTH, DATEDIFF(MONTH, -1, GETDATE())-1, -1) --Last Day of previous month
Select count(*) closed
from performance.JiraItsdClosed
where [Time to resolution] is not null
and resolved between DATEADD(MONTH, DATEDIFF(MONTH, 0, GETDATE())-1, 0) --First day of previous month
and DATEADD(MONTH, DATEDIFF(MONTH, -1, GETDATE())-1, -1) --Last Day of previous month
--
- 7/8/2021 - 219/211
- 6/16/2021 - 163/162
- 5/18/2021 - 229/237
- 4/13/2021 - 201/192
- 4/13/2021 - for feb data - 144/143
- 2/4/2021 - 184/184
- 1/7/2020 - 189/187
- 12/8/2020 - 160/160
- 11/3/2020 - 208/211
- 10/1/2020 – 236/245
- 9/2/2020 – 225/218
- 8/3/2020 – 218/216
- 7/2/2020 – 250/267
NOTE: 7/8/2021 - There is a IT Service Desk report called Created vs Resolved that could provide these same numbers.
The problem is the counts being returned are different:
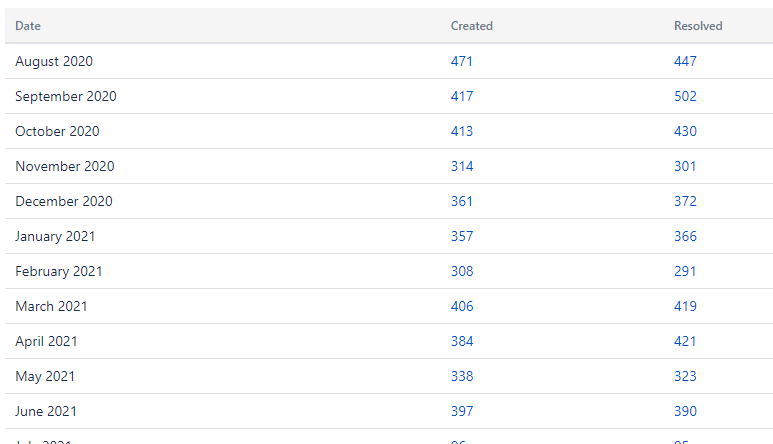
Compare numbers. Maybe I could just back fill and correct. That would save a lot of work.
*** Navigate to the Metrix page used by everyone: http://inside.sda.saccounty.net/isd/admin/SharedDocuments/Forms/AllItems.aspx?RootFolder=%2fisd%2fadmin%2fSharedDocuments%2fISD%20Metrics&FolderCTID=&View=%7b1FB66C2F%2d35A3%2d4C72%2d929D%2dADD77CA8C417%7d
Locate the current month metrics.
If one doesn’t exist it will need to be created.
- Open existing
- Update A3
- Insert a column before AM
- Upload then checkout
Populate Rows 50 and 51 with the results of the first query above. (1st and 2nd numbers)
Save and Checkin (Comment Help desk tickets Received/Closed)
Execute the
Z:\Programming\District Quarterly Reports\Scripts\sasddb1-district-jira-monthly.sql
script.
Navigate to the confluence Service Levels page
Grab the Newest item, and activate the copy command.
Change the title to show the current period
Update the Service Levels page with the contents of the output of this script. The following sections should be populated
- 1 Helpdesk Response Time (Help desk Response time - Objective - 2 hour response time, 100% of the time during business hours)
- 3 Help desk ticket closure (Help Desk Ticket Closure - 4 hours cumulative closure, 80% of the time during business hours)(Use the Second calculation – PC Techs)
- 4 Customer Satisfaction
Save that confluence page. Then after you save the Service Levels page, copy the contents, and then click Create to create a confluence page subordinate to the service levels page you just navigated to.
- Title = Service Levels - 2020-11 - Additional Notes
- Paste the contents from the previous page
- Remove all but the current month from each metric
- Copy the failure details of the first metric from SSMS to Excel, clean that up, and then paste the spreadsheet to the confluence page
- Repeat for second and third tables if necessary.
Create a message to Marty
Sample Message
To: Feldmann. Marty <feldmannm@sacsewer.com>
Subject: Performance Level stuff
Body
Marty,
Monthly’s have been completed.
Here are a few links:
Service Levels:
ISD Metrics:
Service Levels – Additional Notes
I’m not sure what to do with these. What I’d like to do is setup a private area that is only shared between yourself and me. But another option is for you to check them out, and then either move them to your private area … or delete them … or ignore them.
Mark
It would be nice to develop a system to help compute the amount of time I’m spending on certain tasks. Try this for a few months.
Tempo > Reports
Picked the saved report ‘Logged Time’ > Mark’s Monthly – “Tasks Actual vs Estimated”
Switch to prior month
export | Export to Excel
Save to Z:\Programming\District Quarterly Reports\Downloads
Import the Worklogs$ tab into sasdddb1\devsq1.district.Performance.JiraLabor
- 20210616 - unable to import - something about Work Description column would cause truncation. Even excluding it from the import caused problems. I wonder if the work description exceeded the row size.
- 20210518 - unable to import - something about Work Description column would cause truncation. Even excluding it from the import caused problems. I wonder if the work description exceeded the row size.
- 20210413 - 273rows imported
- 20210413 - 223 rows for Feb transferred
- 20210124 - 231 rows transferred
- 20210111 - 286 rows transferred - : Data conversion failed while converting column "[Issue Original Estimate]", "Issue Remaining Estimate" (99) to column "Issue Remaining Estimate" (162). The
- 20201209 - 166 rows transferred
- 20201103 - 206 rows transferred
- 20201001 – 215 rows transferred
- 20200903 – 213 rows transferred
Here are some test statements
-- detail
select [Project Key], j.[Issue Key], [Issue summary], username, [work date]
       , hours, [Issue Original Estimate] , [issue status]
       -- ,*
from performance.jiraLabor j
order by j.[Issue Key]
go
- 20210413 - 1813 rows
- 20210413 - 1540 rows (feb data)
- 20210204 - 1317 rows
- 20210111 - 1086 rows
- 20201209 - 800 rows
- 20201103 - 634 rows
- 20200903 – 213 rows
-- summary
select max([work date]) LastWorkDay, [Project Key], [Issue Key], [Issue summary], UserName
       , sum(hours) totalHours
       , max([Issue Original Estimate]) estimated
from (
       select [Project Key], j.[Issue Key], [Issue summary], username, [work date]
              , hours, [Issue Original Estimate] , [issue status]
              -- ,*
       from performance.jiraLabor j
       -- order by j.[Issue Key]
       ) b
group by [Project Key], [Issue Key], [Issue summary], UserName
--
- 20210413 - 337 rows
- 20210204 - 268 rows
- 20210111 - 218 rows
- 20201209 - 149 rows
- 20201103 - 119 rows
- 20200903 – 47 rows
Save this data into Z:\Programming\District Quarterly Reports\Reports\MarksTime ???
The data is growing so we can just overwrite existing data.